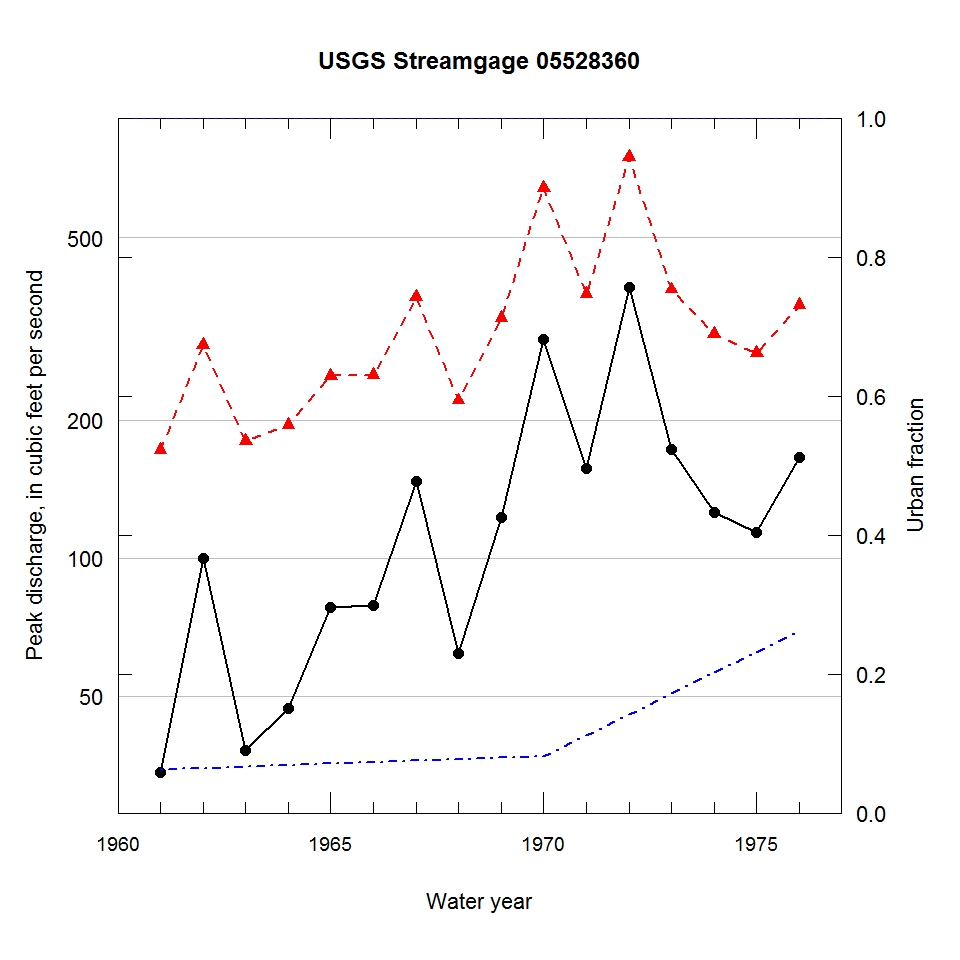
Observed and urbanization-adjusted annual maximum peak discharge and associated urban fraction and precipitation values at USGS streamgage:
05528360 APTAKISIC CREEK AT APTAKISIC, IL


| Water year | Segment | Discharge code | Cumulative reservoir storage (acre-feet) | Urban fraction | Precipitation (inches) | Observed peak discharge (ft3/s) | Adjusted peak discharge (ft3/s) | Exceedance probability |
| 1961 | 1 | -- | 0 | 0.062 | 1.379 | 34 | 172 | 0.938 |
| 1962 | 1 | 2 | 0 | 0.064 | 0.249 | 100 | 292 | 0.558 |
| 1963 | 1 | -- | 0 | 0.066 | 1.128 | 38 | 180 | 0.927 |
| 1964 | 1 | -- | 0 | 0.069 | 1.774 | 47 | 195 | 0.890 |
| 1965 | 1 | 2 | 0 | 0.071 | 0.091 | 78 | 250 | 0.713 |
| 1966 | 1 | 2 | 0 | 0.073 | 0.416 | 79 | 251 | 0.708 |
| 1967 | 1 | -- | 0 | 0.075 | 1.466 | 147 | 371 | 0.299 |
| 1968 | 1 | -- | 0 | 0.077 | 1.142 | 62 | 221 | 0.814 |
| 1969 | 1 | 2 | 0 | 0.080 | 1.285 | 123 | 334 | 0.418 |
| 1970 | 1 | 2 | 0 | 0.082 | 1.333 | 300 | 643 | 0.042 |
| 1971 | 1 | 2 | 0 | 0.112 | 0.385 | 157 | 377 | 0.280 |
| 1972 | 1 | -- | 0 | 0.142 | 0.692 | 390 | 750 | 0.020 |
| 1973 | 1 | -- | 0 | 0.172 | 1.383 | 173 | 386 | 0.255 |
| 1974 | 1 | 2 | 0 | 0.202 | 0.523 | 126 | 308 | 0.500 |
| 1975 | 1 | -- | 0 | 0.232 | 0.951 | 114 | 280 | 0.605 |
| 1976 | 1 | -- | 0 | 0.262 | 0.974 | 166 | 357 | 0.344 |

